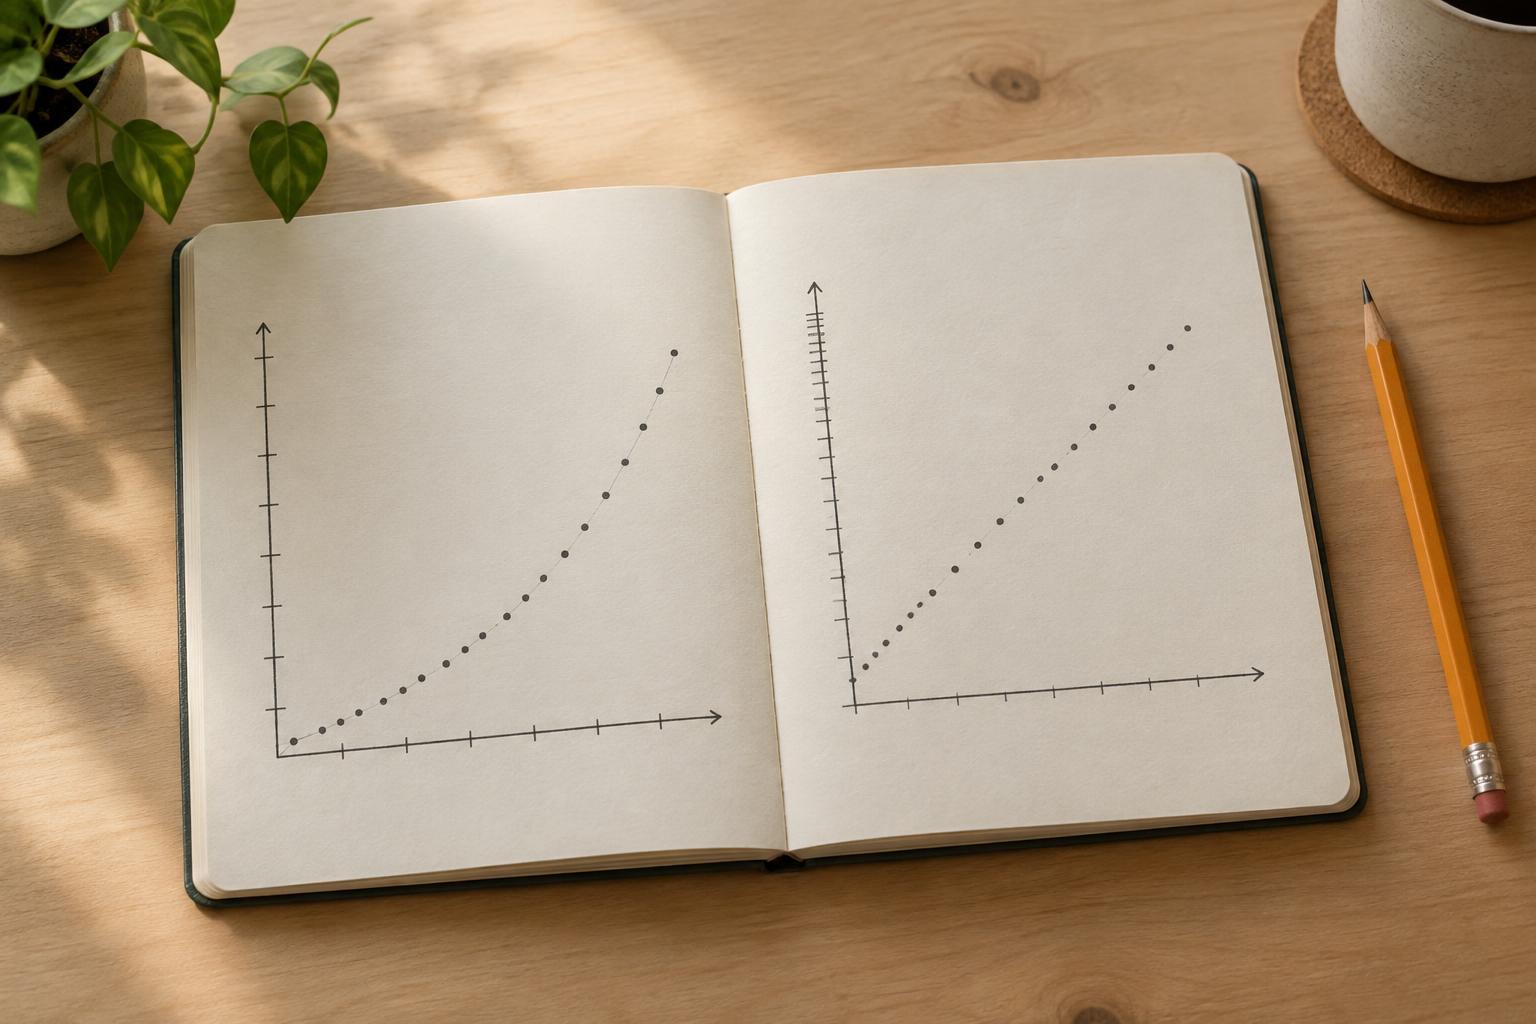
The question to ask first: What does equal space mean?
Before reading a line or comparing two points on a chart, look at the axis labels. On a linear scale, equal distances represent equal numerical differences. An axis marked 0, 10, 20, 30 at evenly spaced positions is linear: moving one interval always adds 10. On a logarithmic scale, equal distances represent equal ratios. An axis marked 1, 10, 100, 1,000 at evenly spaced positions is logarithmic: moving one interval always multiplies the value by 10.
This difference changes what looks large or small. The gap from 10 to 20 is the same size as the gap from 100 to 110 on a linear scale because both add 10. On a logarithmic scale, the gap from 10 to 20 matches the gap from 100 to 200 because both double. Neither scale changes the underlying observations. Each emphasizes a different kind of comparison.
Reading a linear scale
A linear scale is a natural choice when the question concerns absolute differences. Suppose a team records 20, 30 and 40 responses across three sessions. On a linear vertical axis, the rise from 20 to 30 occupies the same height as the rise from 30 to 40. You can see that each session added 10 responses, even though the percentage increase was smaller the second time.
Check where the axis begins and how its tick marks are spaced. A line chart can start above zero if the labels make that clear, but a narrow vertical range can make a modest change look dramatic. For bars, height is typically read as an amount measured from a baseline, so a truncated vertical axis can be especially misleading. Read the labeled values rather than relying only on the visual height or steepness.
Reading a logarithmic scale
A logarithmic scale is useful when values span several orders of magnitude, such as 1 to 10,000, or when proportional change matters more than the number of units added. On a base-10 logarithmic axis, the intervals from 1 to 10, 10 to 100 and 100 to 1,000 take up equal space. Values between those marks are not placed as they would be on a linear axis. For example, 50 sits between 10 and 100, but it is not halfway between them.
To interpret a move on a log axis, ask how many times larger or smaller the value has become. A move from 5 to 50 and one from 50 to 500 cover equal distances on a base-10 log scale because each is a tenfold increase. A steadily rising straight line on a graph with a logarithmic vertical axis and a linear time axis can suggest a roughly constant growth rate in percentage terms. Confirm that impression by checking the values.
Limits and labels worth checking
An ordinary logarithmic axis cannot display zero or negative values: there is no power of a positive base that produces zero or a negative number. If a dataset contains them, check whether the chart omits those observations, uses a different transformation or applies a specially designed scale. Do not assume a log chart shows every value in the original data.
Also check which axis is logarithmic. A chart may use a log scale on the vertical axis, the horizontal axis or both. Look for labels such as 1, 10, 100 and 1,000, but do not rely on their appearance alone; an axis should identify its scale. If ticks are missing or the caption is unclear, avoid drawing precise conclusions from the spacing.
Choosing the scale that answers your question
Imagine two projects whose output rises from 10 to 20 units and from 100 to 200 units. Both double, but one adds 10 units while the other adds 100. A logarithmic scale gives the increases the same visual height, highlighting their equal proportional growth. A linear scale makes the second increase much taller, highlighting its greater absolute gain. Choosing between them depends on which comparison matters to your question.
When presenting findings, name the scale and explain what a step on the axis means. If your audience needs to compare both absolute and proportional changes, consider showing the values in a small table alongside the chart, or providing two clearly labeled views. When reading someone else’s chart, pause before describing a line as steep or a gap as small. First establish whether equal space means equal amounts or equal ratios.