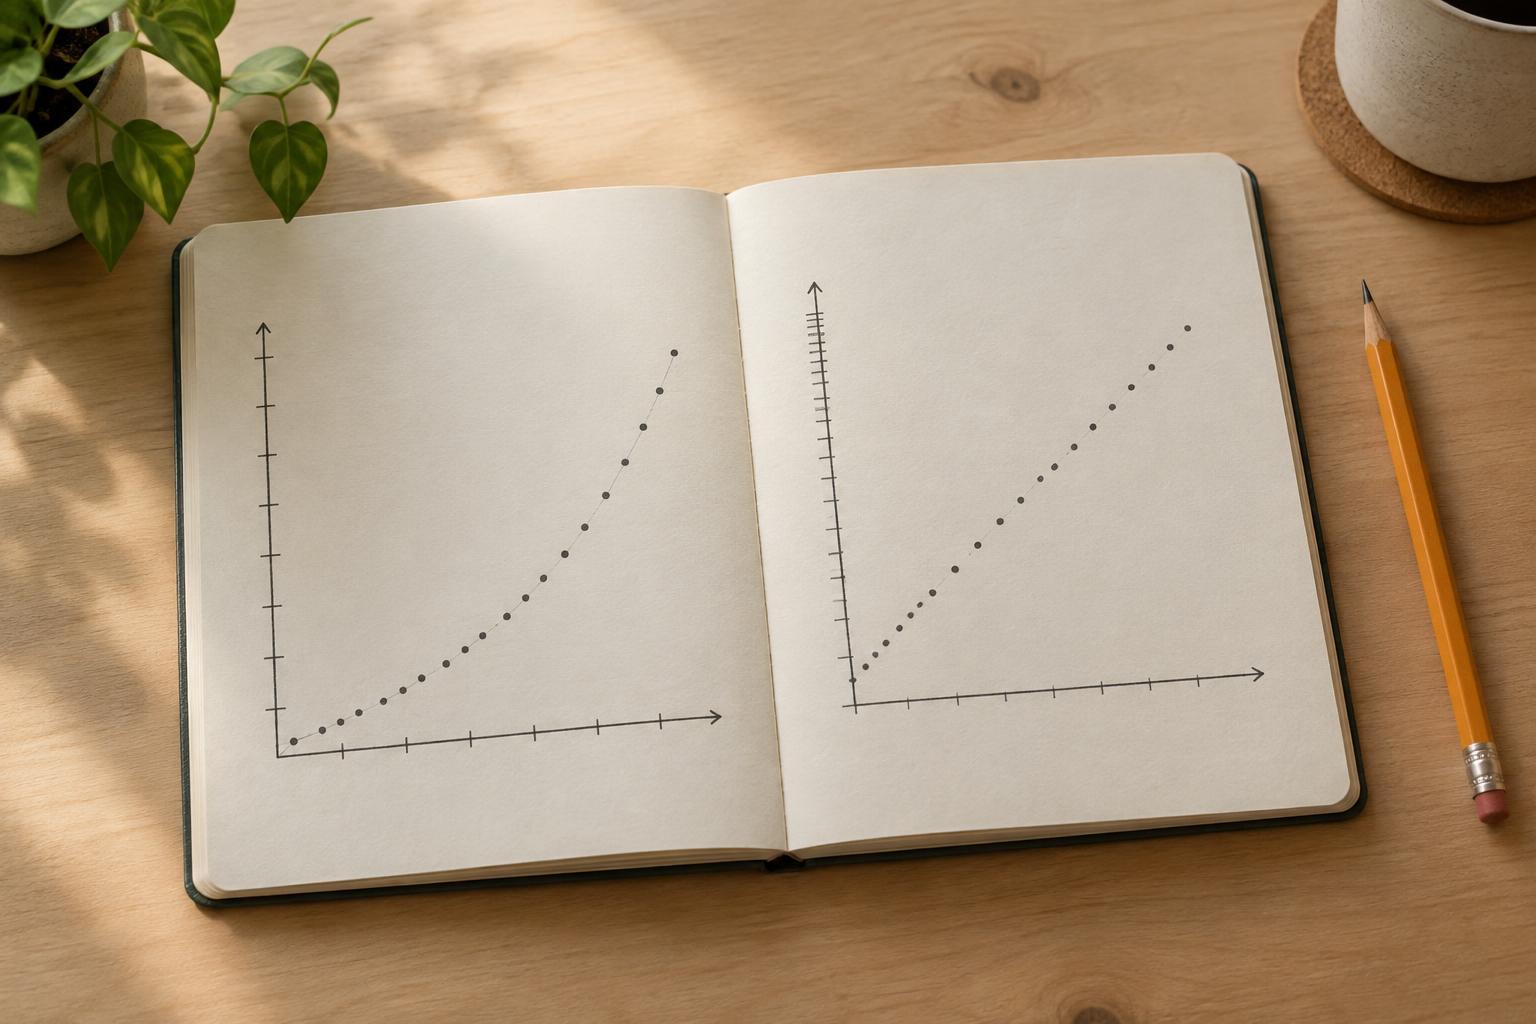
What does the starting value of 100 mean?
An index expresses values relative to a chosen starting point, called the base. The base value is set to 100, and every other value shows how large the measured quantity is compared with that base. If a monthly sales index starts at 100 and later reaches 120, sales are 20% higher than they were in the base month. An index of 85 means they are 15% lower than in that month.
The calculation is straightforward: divide the value you want to describe by the base value, then multiply by 100. If a store sold 200 units in the base month and 250 units in a later month, the later index is (250 ÷ 200) × 100 = 125. The index shows the relative change, not the number of units sold. Without the original figures, you cannot recover the store’s sales volume from the index alone.
Read changes from the right reference point
Because 100 represents the base, subtracting 100 from an index value gives the percentage change since the base. At 135, the measured quantity is 35% above its base value. At 70, it is 30% below. This shortcut works only when your question is about change from the base.
To find the change between two other points, use the earlier index as the reference. Suppose an index rises from 120 to 150. The difference is 30 index points, but the percentage increase is (150 − 120) ÷ 120 × 100 = 25%. Saying it rose by 30% would use the wrong denominator. Likewise, a fall from 150 to 120 is a decrease of 20%, because 30 ÷ 150 = 0.20. Equal moves in index points do not always represent equal percentage changes.
Compare indexed series without confusing growth and size
Indexing can make trends easier to compare when the original quantities have different units or very different starting sizes. Imagine one service handled 1,000 requests in its base month and another handled 100. If their indexes later reach 110 and 130, respectively, the second service has grown faster relative to its own starting point: 30% versus 10%. But its later total is 130 requests, compared with 1,100 for the first service. The higher index does not mean the larger total.
Before comparing lines on an indexed chart, check whether they share the same base period. If one series uses January as its base and another uses June, a value of 120 refers to a different starting point for each. You may still learn something from each line, but their positions do not describe change over an identical period. A common base period makes a side-by-side comparison of growth easier to interpret.
Watch for rebasing and changes in what is measured
A dataset can be rebased: the same observations are expressed relative to a different starting value. For example, an existing index has values of 80 in one month and 100 in a later month. If the month at 80 becomes the new base, its new index is 100 and the later month’s index is (100 ÷ 80) × 100 = 125. The underlying change has not altered; only the reference point has.
Rebasing is different from changing the measure itself. A chart labeled as an index might track prices, output, visits or a combination of measures. Its meaning depends on what was counted and how. If the definition changes during the series, an apparent rise or fall may not reflect a like-for-like change. Read the chart’s labels and any accompanying explanation before drawing a conclusion.
Use an index to answer a precise question
Start by asking what quantity the index measures, which observation equals 100 and what period each value covers. Then decide whether you need change from the base or change between two later points. If the chart shows an index of 140 in one year and 126 in the next, the quantity remains 26% above its base, but it has fallen by 10% from the previous year: (126 − 140) ÷ 140 × 100 = −10%. Both statements can be true.
Finally, consider what the index cannot tell you. A rising price index does not, by itself, show how many items people bought. An indexed total does not reveal how that total is distributed among groups. Treat 100 as a useful reference point, not a score for quality or a normal level. The strongest interpretation states the base, names the measured quantity and makes clear which two points are being compared.