The picture depends on more than the values
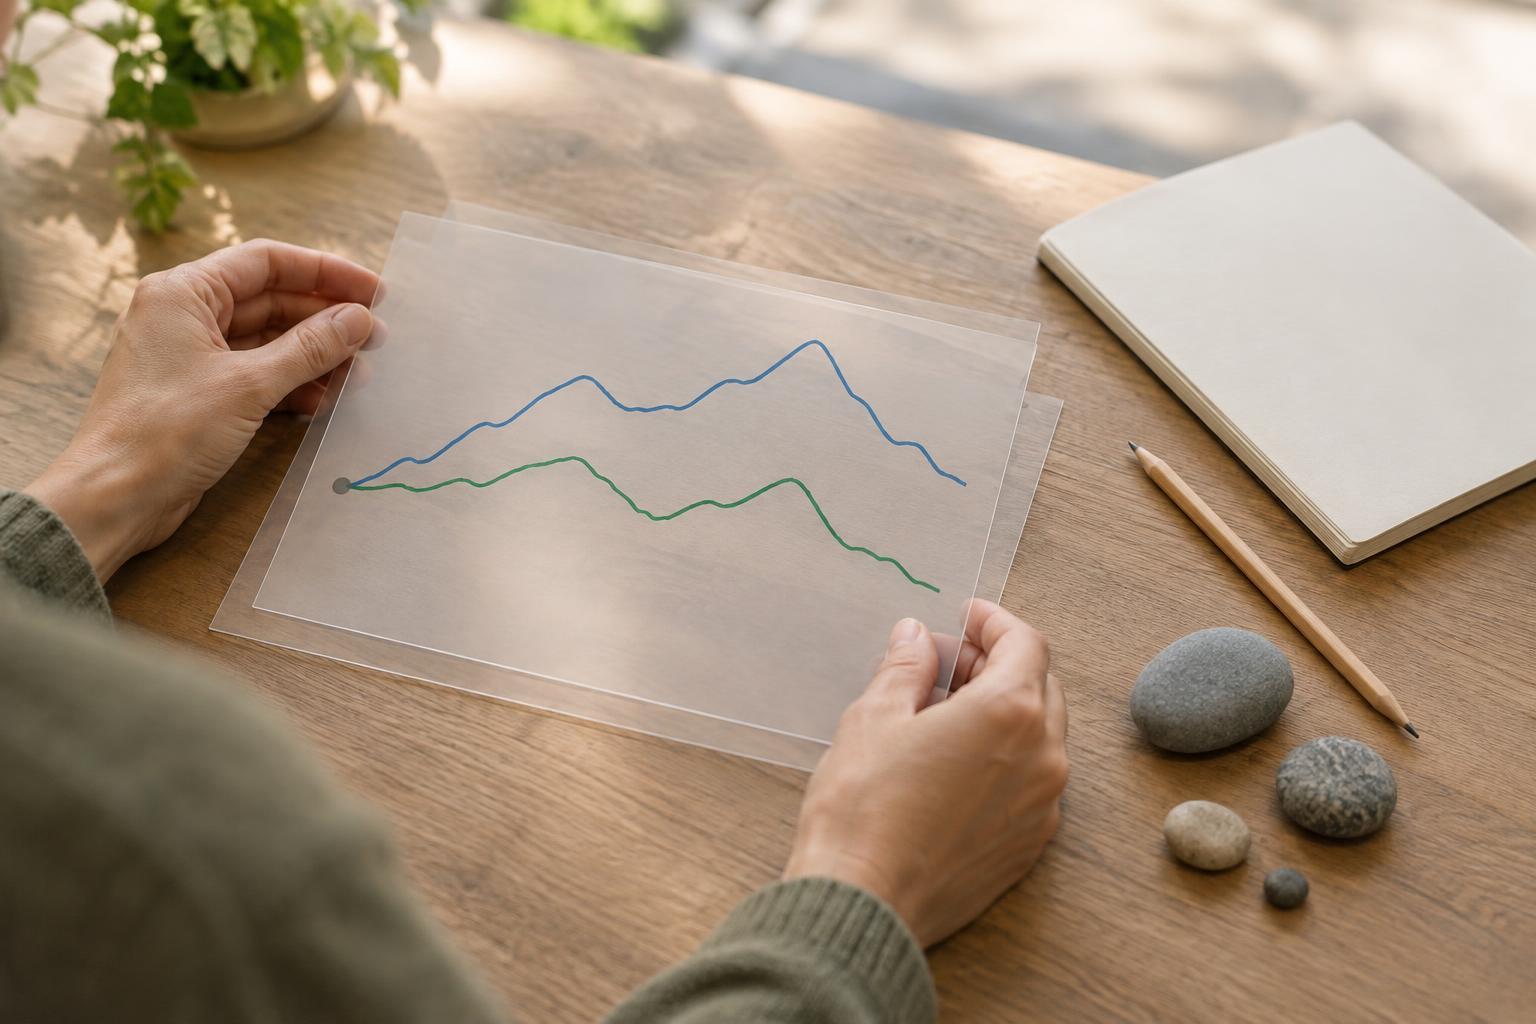
A chart turns numbers into distances. The height of a bar, the slope of a line and the gap between two points all invite a visual judgment before you read the labels. But those distances depend partly on choices the chart maker controls: where an axis starts and ends, and how observations are spaced along it.
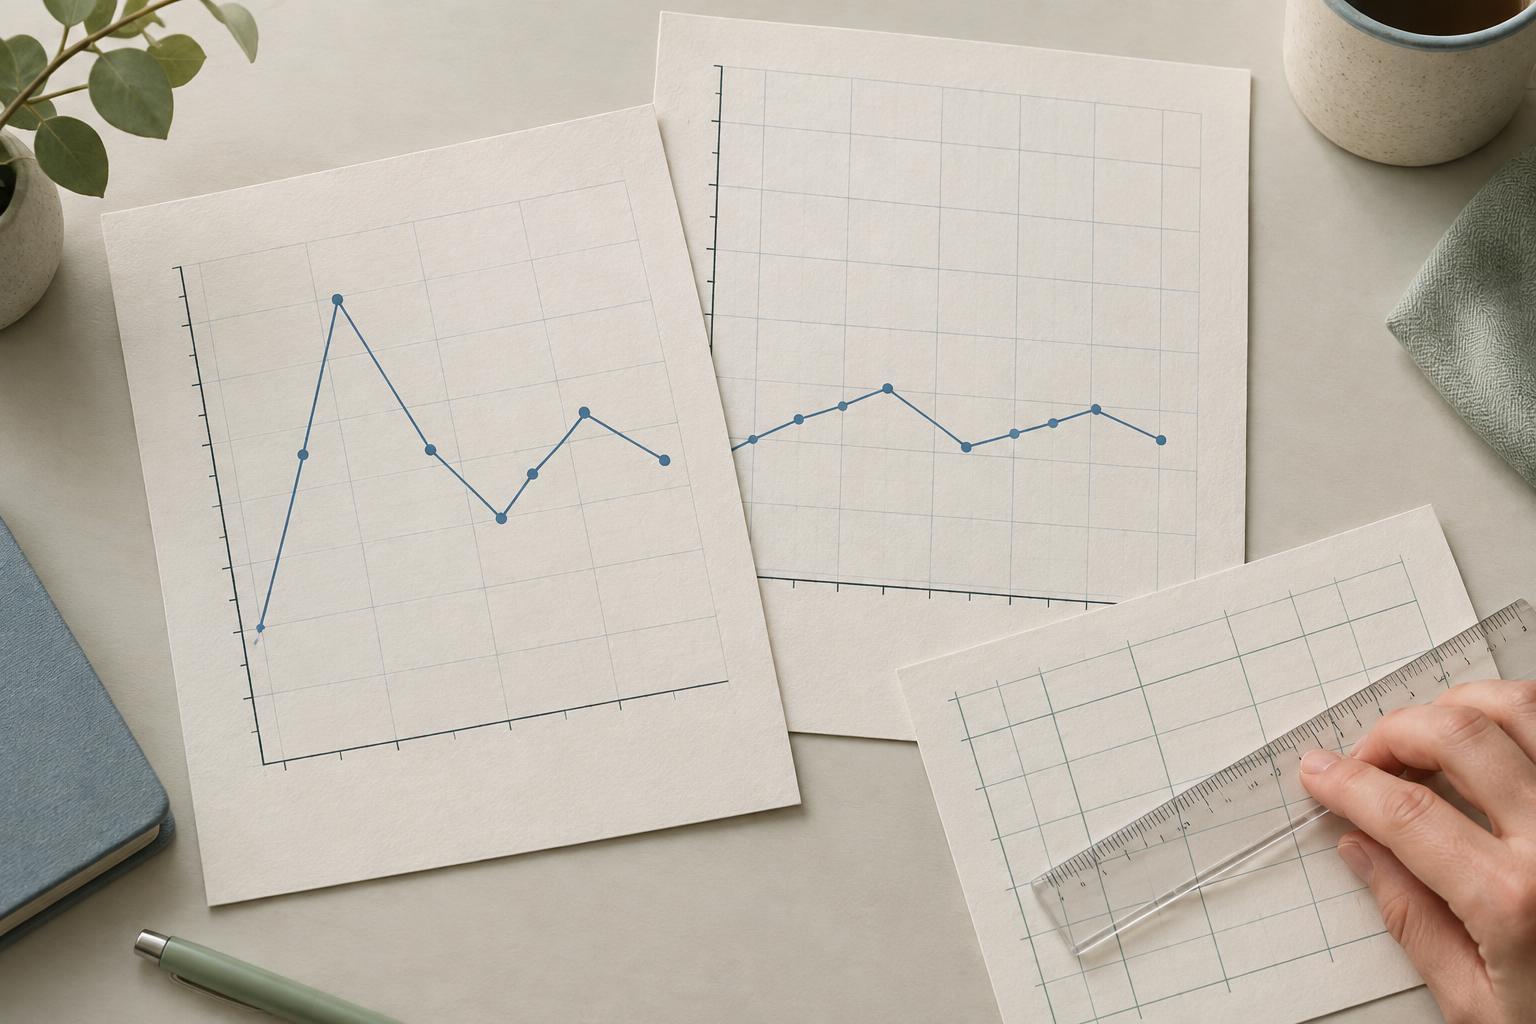
Imagine a hypothetical measure that rises from 48 to 52. On a vertical axis running from 0 to 60, the rise looks modest. On an axis running from 47 to 53, it fills much of the chart. Both versions can plot the same values accurately. Neither view, by itself, tells you whether the change is important. That depends on what the measure represents and the question you are asking.
Check where the vertical axis begins and ends
A narrow vertical range makes small differences easier to see. That can be useful when the purpose is to inspect variation, but it can also make a minor change feel dramatic. A wide range provides more context, though it may conceal a pattern worth noticing. When you see a steep line or a large-looking gap, read the axis labels and tick marks before describing the size of the change.
Chart type matters here. In a bar chart, the length of each bar usually represents the value, so starting the value axis above zero can distort the apparent ratio between bars. In a line chart, the main task is often to follow change over time; a nonzero starting point can be reasonable if it is clear and helps reveal meaningful variation. Even then, read the actual values rather than treating the line’s steepness as a measure of importance.
The upper limit matters too. If a series of values sits close to the top of the plotting area, check whether the chart ends there because of a meaningful boundary or simply because the range was chosen to fit the observations. Ask what would happen to your first impression if the vertical range were wider.
Unequal intervals can change the apparent pace
On a time chart, equal horizontal distances should normally represent equal amounts of time. Suppose a hypothetical series has observations in January, February and June. If those three points are placed at equal distances, the chart gives the one-month gap and the four-month gap the same visual width. A line connecting the points may then suggest a steadier rate of change than the observation dates support.
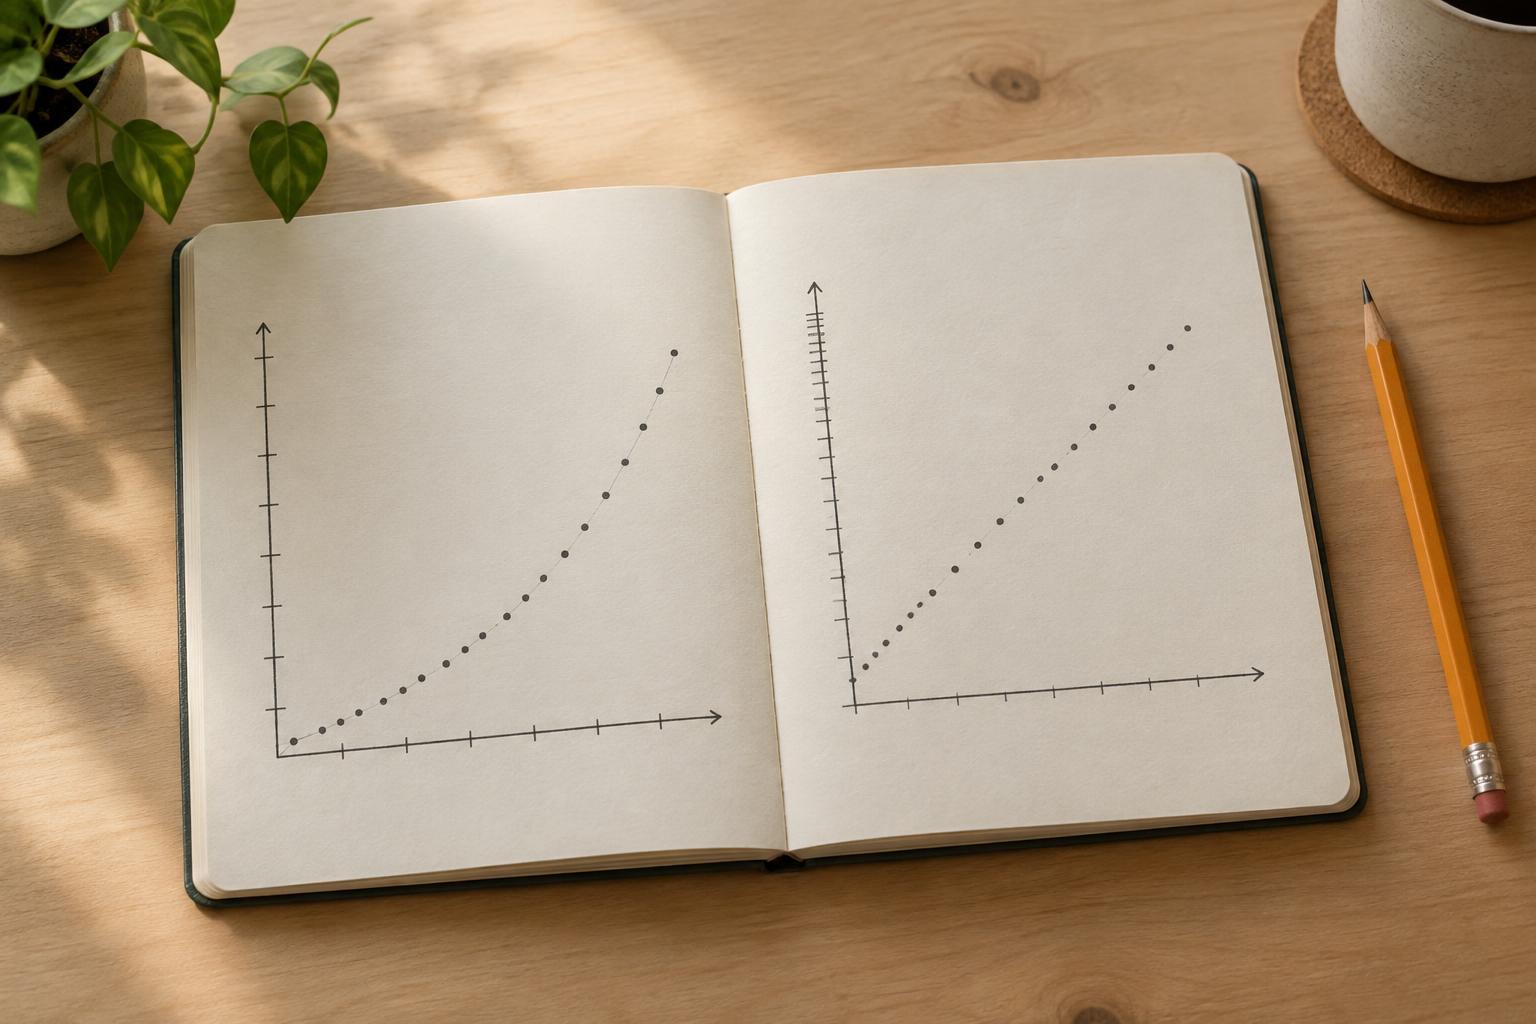
Spacing matters on other numeric axes as well. Values recorded at 1, 2 and 10 units should not usually be placed like three equally spaced categories if the chart invites readers to judge a trend across the numeric range. A categorical display can be appropriate when the labels are groups rather than positions on a continuous scale. The key is to know which interpretation the horizontal axis is asking you to make.
Missing observations add another complication. A line drawn across a long gap connects known endpoints, but it does not show what happened between them. Before saying that a measure rose steadily, check the dates or numeric positions of the observations and whether any intervals contain no data.
Read the scale before drawing a conclusion
Start with a few concrete questions: What does each axis measure? What are its minimum and maximum labels? Are the steps between tick marks equal in value? Are the plotted observations equally far apart in the underlying data? Then compare the numbers behind the shape. A change of four units may be large or small in context, regardless of how much space it occupies on the page.
Watch for scale changes that are easy to overlook. A logarithmic axis, for example, uses equal visual steps for equal ratios rather than equal numeric differences. It can help show values across a wide range, but a reader who assumes a linear scale may misread the pattern. An axis break likewise changes how distances should be interpreted. Neither device is automatically misleading; both need clear labeling.
Make chart choices visible when presenting data
If you are making a chart, choose limits that serve the question without overstating the result. Use a zero baseline for bars when bar lengths represent quantities. For a line chart with a narrowed range, label the axis clearly and consider whether readers also need the broader context. Place observations according to their actual dates or numeric positions when spacing carries meaning.
Finally, write a caption that states the change in words and values rather than relying on visual drama. For the hypothetical rise from 48 to 52, say that the measure increased by four units over the specified interval. That statement remains understandable even if the chart is resized or redrawn. A useful chart helps readers see a pattern; its labels and explanation help them judge what the pattern means.