Start with the question behind the line
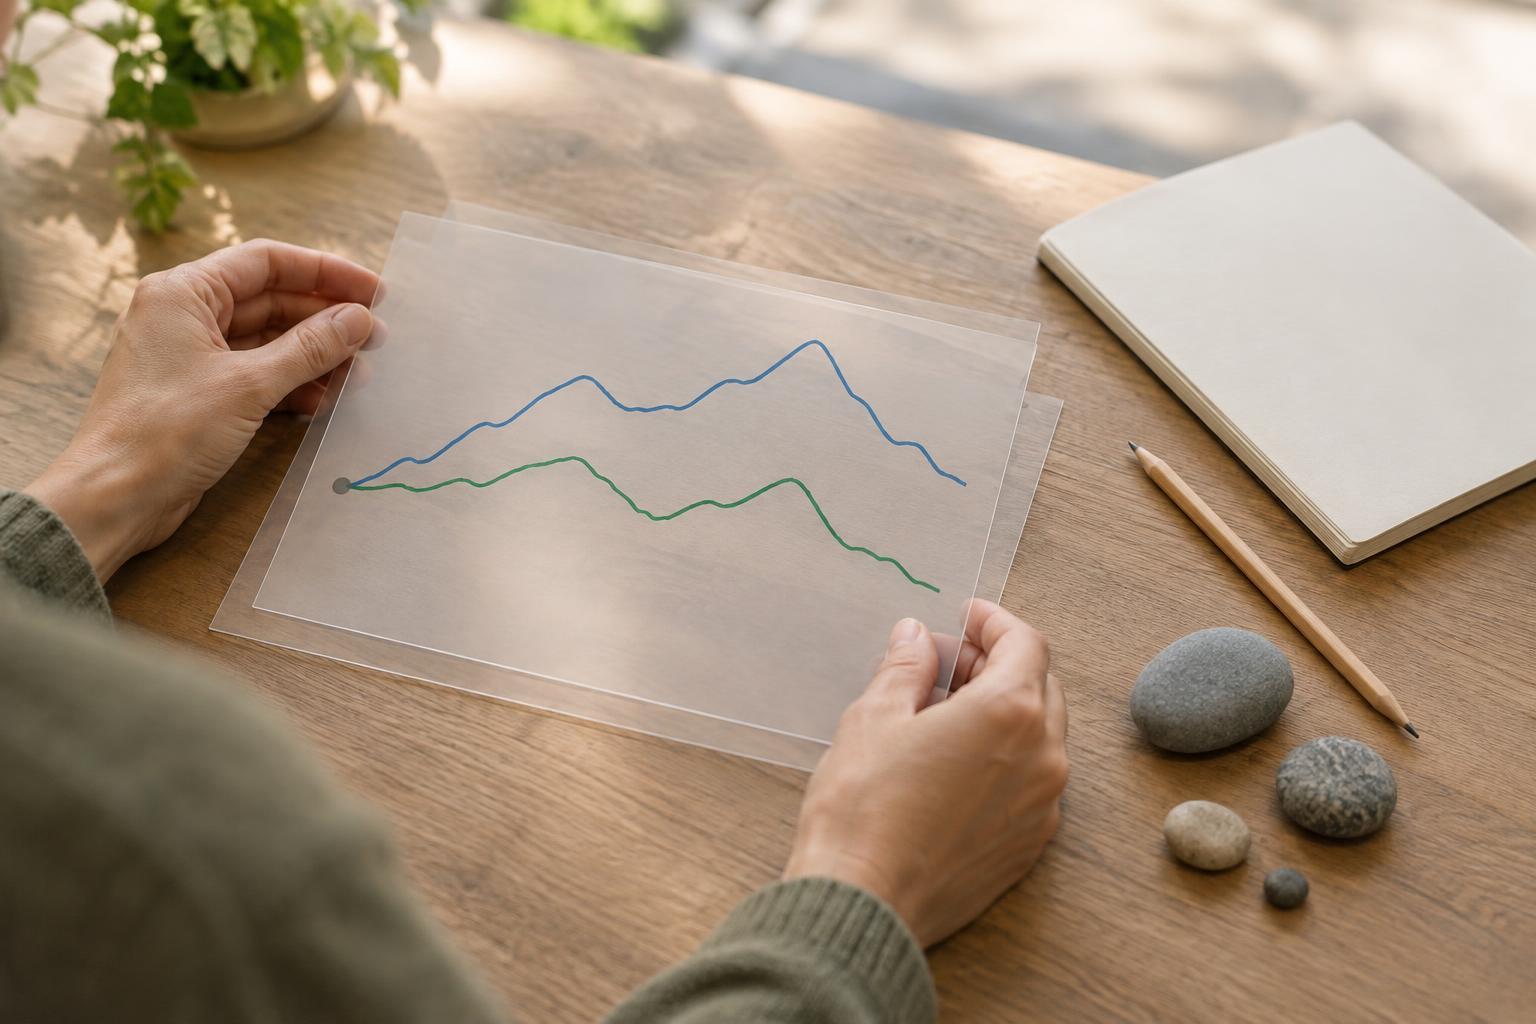
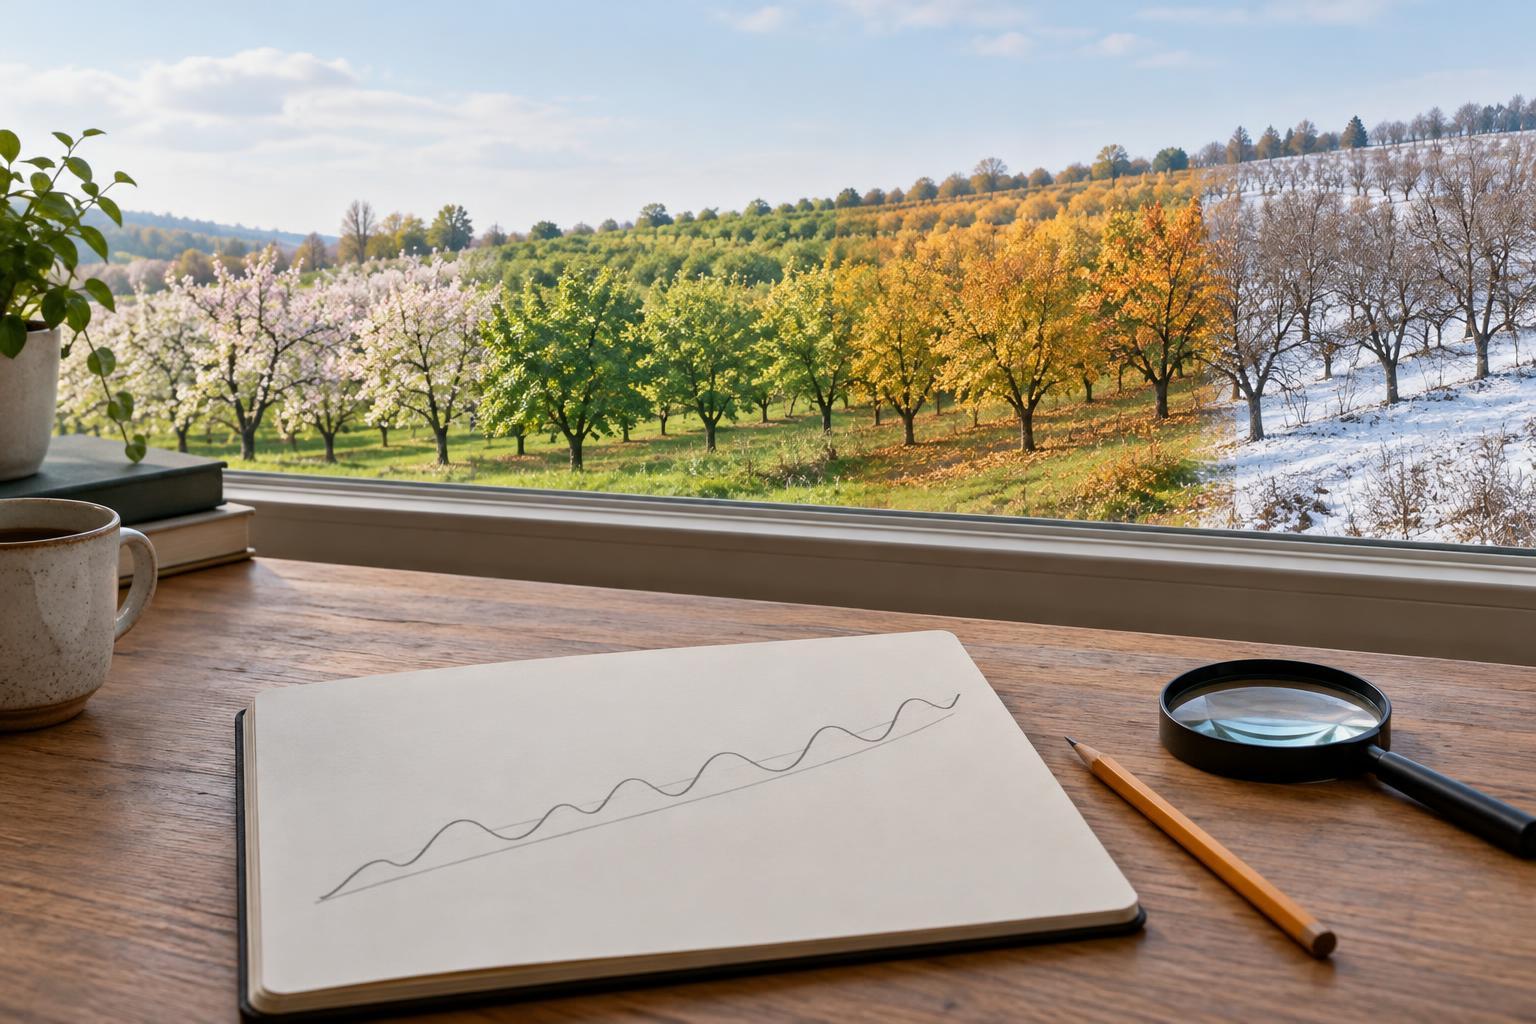
A time series is a set of measurements recorded over time, such as monthly library visits or weekly product orders. A trend is a sustained movement in the underlying level of the series. Seasonal variation is a pattern that tends to repeat at a regular point in a calendar cycle, such as a particular month or day of the week. The two can happen at once: library visits might rise across several years while still dipping during the same holiday period each year.
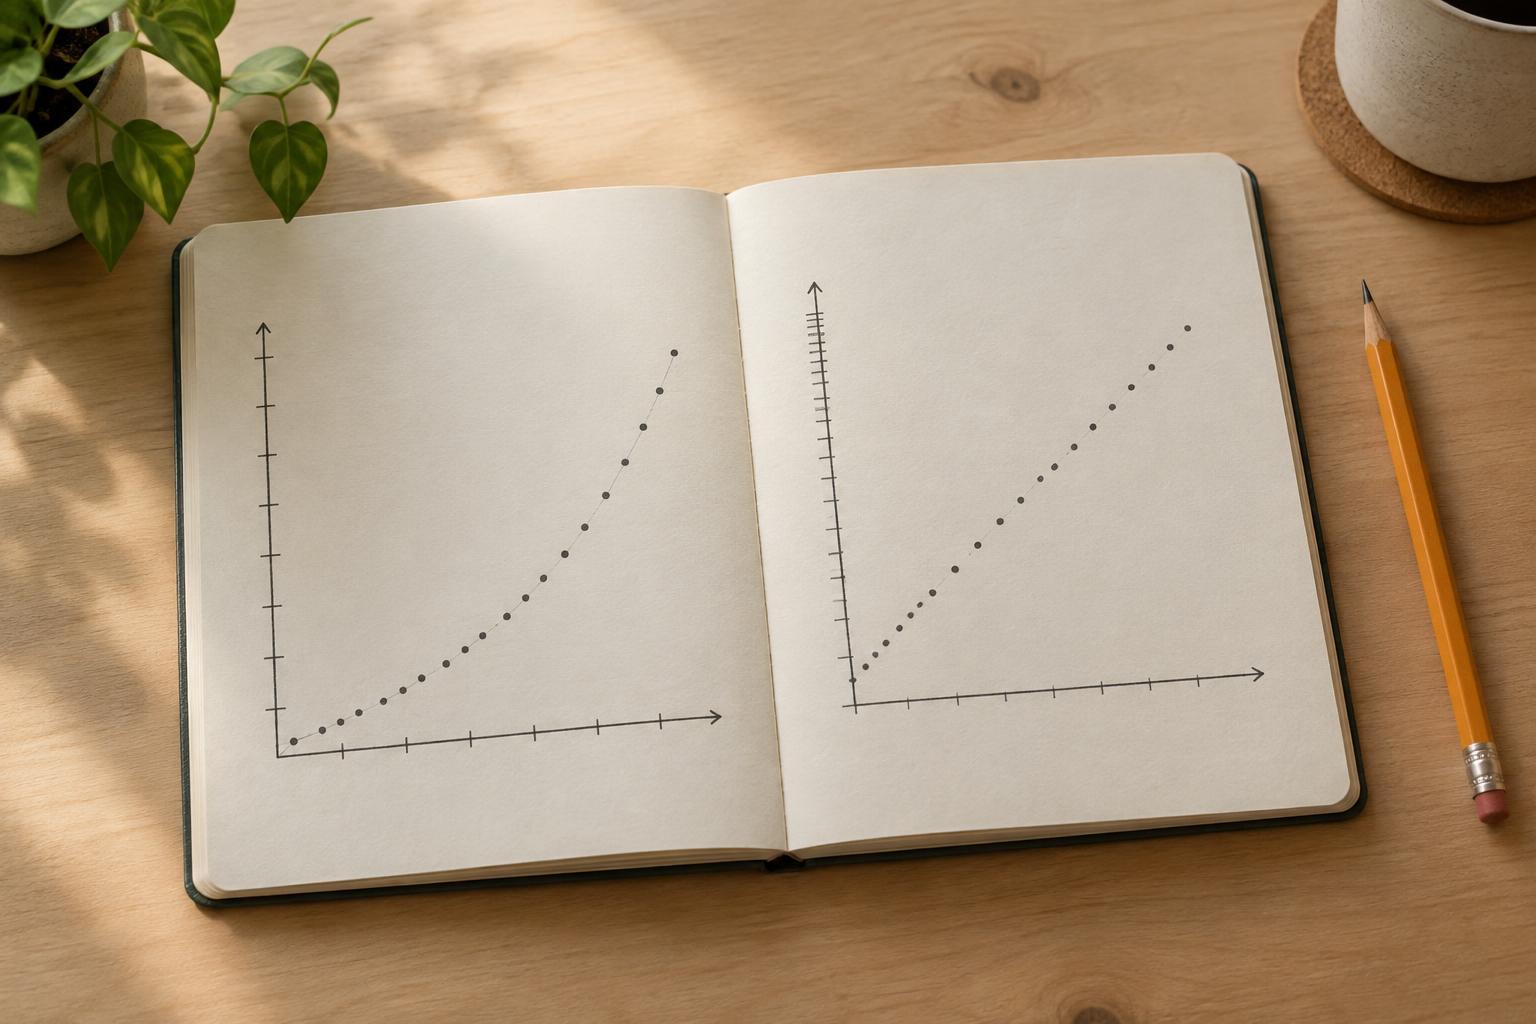
Before interpreting a chart, check what each point measures and how often it was recorded. A series of monthly totals is not directly comparable to a series of monthly averages. Months also have different numbers of days, which can affect totals. If the question concerns demand per day, a daily average for each month may be more informative than a monthly total. Consistent definitions and time intervals make it easier to judge whether a visible change reflects the phenomenon or the way it was measured.
Look for repetition, not just movement
A single high or low point is not enough to establish seasonality. Look instead for a similar pattern at comparable times in multiple cycles. If visits fall each December and recover each January, that repetition is evidence of a seasonal pattern. If they fall in one December but not in others, an event specific to that year may be a better explanation. Several complete cycles help you see whether the pattern repeats, though they do not guarantee it will continue.
To inspect a monthly series, compare each month with the same month in earlier years. You can also place years on separate lines, with January through December along the horizontal axis. This view makes recurring peaks and dips easier to spot than a single long line. For weekly data, consider whether day-of-week patterns matter; for daily data, both weekday and annual patterns may be relevant. Choose the cycle based on how the activity works, rather than assuming every fluctuation is seasonal.
Compare like with like to assess the trend
Suppose library visits are higher in June than in January. That does not, by itself, show growth: June may normally be busier. Comparing this June with last June gives a clearer view of change because both observations occupy the same place in the annual cycle. Repeat that comparison across several months. If most comparable months are gradually higher than in earlier years, a rising underlying level becomes more plausible, even if the line still dips each winter.
A moving average can offer another view. For monthly data with an annual pattern, an average spanning a full year can reduce the visual effect of recurring monthly highs and lows. Plotting the smoothed line alongside the original preserves both views. Smoothing does not remove uncertainty, however. It can hide brief changes, and values near the beginning or end of a series may depend on fewer observations or on the chosen calculation. Treat the smoothed line as a reading aid, not proof of a trend.
Check whether other changes explain the pattern
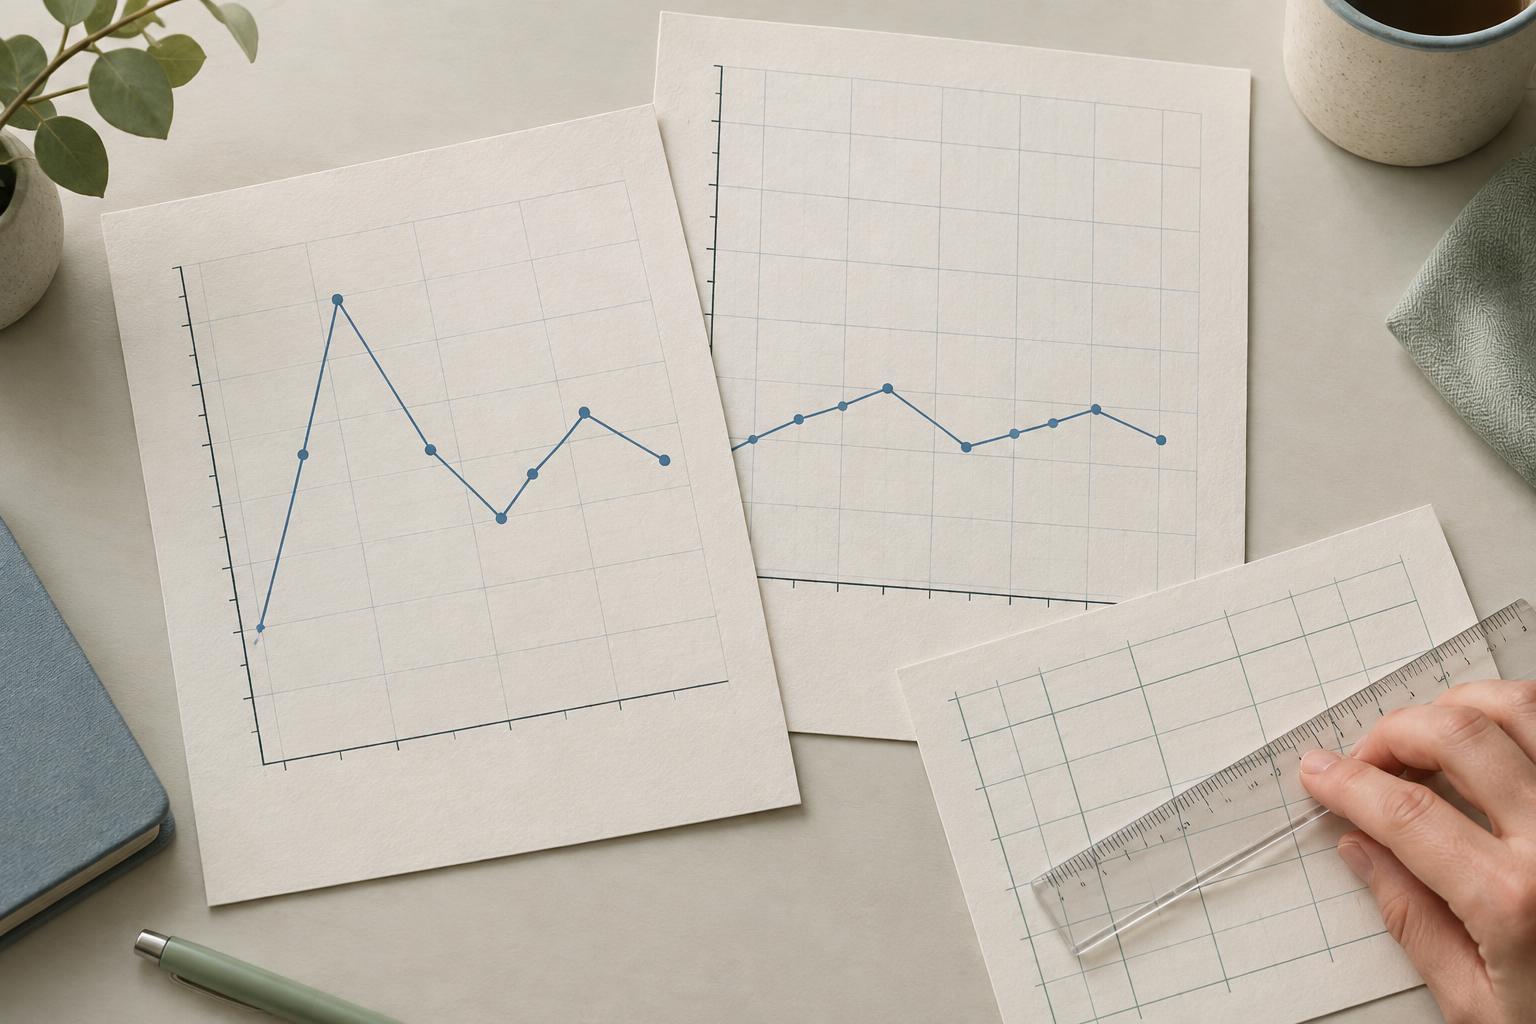
Not every repeated-looking rise or fall is caused by the calendar. A changed opening schedule, a new counting method or missing records can create a break in a series. An unusually large event can create a spike that does not belong to either a trend or a seasonal cycle. Note such changes before drawing conclusions, and mark them on a chart when they are known. Otherwise, a measurement change may be mistaken for a change in behavior.
Also check whether the seasonal pattern itself is stable. A busy season may shift in timing or grow larger as the overall series grows. In that case, subtracting the same fixed seasonal amount every year could distort the picture. For a practical first pass, inspect both the original values and same-season comparisons. If the pattern changes substantially, describe that change rather than forcing the series into a neat separation between trend and seasonality.
Explain what the data supports
A useful summary names the time interval, the recurring pattern and the longer-term movement separately. For example: “Monthly visits tend to peak in summer. Comparing the same months across the available years suggests a gradual increase, although one year contains an unusual drop.” This is more informative than saying simply that visits are “going up,” which may confuse a summer peak with lasting growth.
State the limits of your view. With less than a full seasonal cycle, it may be impossible to identify a repeating annual pattern. With only one or two cycles, an apparent pattern may be coincidence. If the series contains gaps or changes in measurement, say so. The aim is not to strip every fluctuation away; it is to make clear which movements recur, which appear sustained and which remain unexplained.