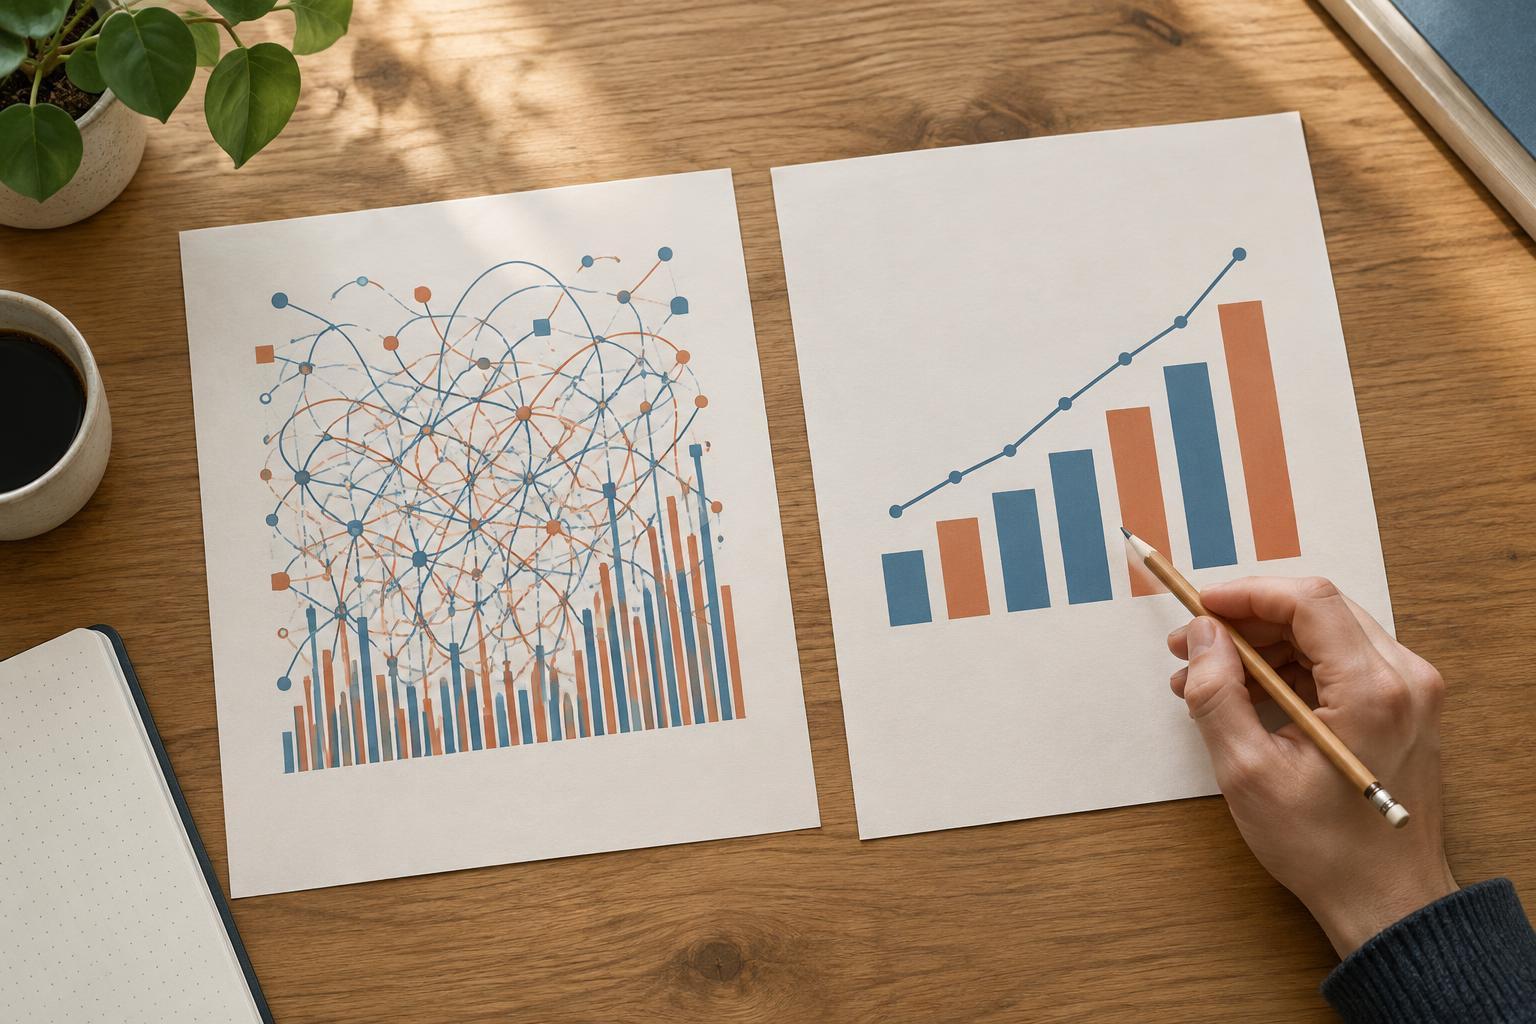
What does “stand alone” mean?
A figure stands alone when a reader can understand what it shows without hunting through the main text. That does not mean repeating the entire report beneath a chart. It means supplying the context needed to identify the subject, read the display correctly, and recognize important limits. This matters when someone scans a report, views a slide out of sequence, or returns to a figure after forgetting the surrounding argument.
Think of the figure as several parts working together. The image carries the pattern or comparison. Its labels identify categories, axes, units, and symbols. The title states the subject. The caption explains how to read what is shown. Notes handle definitions, qualifications, and provenance that would clutter the image. If essential information appears in none of these places, the figure is not yet self-contained.
Give the title one clear job
A useful figure title names the subject and, where relevant, the measure, population, place, or period. “Survey results” is too broad. “Share of respondents choosing each commute option, by work arrangement” tells readers what they are about to compare. The exact wording depends on the figure: a map may need a location, while a process diagram may need to name the process and its starting point.
Keep the title descriptive rather than argumentative. “Remote workers prefer cycling” may overstate a chart if cycling is only slightly more common in one group or if the survey cannot establish a general preference. A neutral title leaves room for readers to inspect the evidence. If your publication uses numbered figures, pair the number with the title consistently, but do not make the number do the title’s work.
Use the caption to guide the reading
The caption should answer the questions a reader is likely to have on first encounter. What do the marks or panels represent? What is being compared? Is a higher value better, worse, or simply larger? For a chart, specify a measure’s unit if it is not unmistakable from the axes. For a photograph or diagram, identify features the discussion depends on rather than describing every visible detail.
For example, imagine a bar chart based on a fictional classroom survey. Its title is “Commute options reported by students in two course sections.” Its caption might read: “Bars show the percentage of respondents in each section who selected each option as their main way of getting to campus. Each section is calculated separately, so percentages should be compared across sections within an option.” The caption explains both the marks and the comparison without claiming why any difference exists.
Avoid using the caption as a second results section. A brief observation can help direct attention, but the figure and accompanying text should support any interpretation. If a pattern requires several caveats to describe accurately, explain it in the body of the report and keep the caption focused on reading the display.
Put necessary qualifications in notes
Notes are useful for details that affect interpretation but do not belong in a short title or inside the image. These can include definitions of abbreviations, the treatment of missing responses, whether categories can overlap, or what an error bar represents. In the classroom example, a note could say: “Students who did not answer the commute question are excluded. ‘Other’ combines responses not listed separately.” Without that information, a reader might assume every student appears in the chart or that all options are shown.
If a figure draws on material you did not create, identify its source or credit as required by your publication and the material’s terms. If you adapted a dataset or illustration, make the nature of that adaptation clear. A source line tells readers where the underlying material came from; it does not substitute for an explanation of what you calculated or changed. Keep notes close enough to the figure that they will travel with it when copied into a slide or shared document.
Test the figure outside its original page
Before publishing, cover the surrounding paragraphs and inspect the figure by itself. Can you name the population or material shown? Can you tell what each color, line, or panel means? Are the units, time frame, and denominator clear where they matter? If the chart reports percentages, can you tell what each percentage is a share of? If uncertainty is displayed, is its meaning stated? Add only the missing information; excessive annotation can make the main comparison harder to see.
Then check the figure as an image, not just as prose. Labels should remain legible at the size in which readers will see it. Do not rely on color alone to distinguish important categories if direct labels, patterns, or distinct line styles can help. Where your publishing format supports alternative text, provide a concise description of the figure’s purpose and key pattern; a caption may supply context, but it may not describe the visual information to someone who cannot see it.
Finally, compare the title, caption, notes, labels, and main text for consistency. They should use the same category names and describe the same measure. A stand-alone figure is not one that says everything. It is one that lets a reader understand what is displayed, make the intended comparison, and see where interpretation needs care.